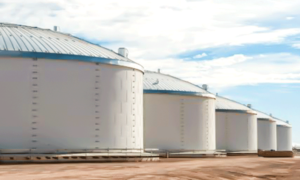
Viking Cold Solutions, Inc. conducted a Measurement and Verification (M&V) study of its thermal energy storage (TES) technology installed in an industrial low-temperature cold storage warehouse. The objectives of the M&V study were to determine the effectiveness of TES on energy efficiency and temperature stability with an ammonia-based refrigeration system.
The M&V study concluded that TES provided a 43 per cent decrease in peak period consumption and a 29 per cent decrease in peak demand while improving overall temperature stability by 50 per cent in a low temperature warehouse.
- Peak Period – the entire 13-hour period of increased energy costs from 8:30 am to 9:30 pm Monday through Friday
- Partial Peak Period – 8:30 am to 12:00 pm and 6:00 am to 9:30 pm Monday through Friday
- Full Peak Period – 12:00 pm to 6:00 pm Monday through Friday
- Off Peak Period – 9:30 pm to 8:30 am Monday through Friday and weekends
- Summer season is May through October; Winter season is November through April (with Partial Peak pricing 8:30 am to 9:30 pm Monday through Friday during winter)
The utility rate plan for the facility was Pacific gas and electric’s (PG&E) E20 schedule, which includes time-of-use pricing. Pricing for kWh consumption and peak kW demand varies across three distinct rate periods each day and seasonally from summer to winter. Peak period consumption charges and peak demand charges account for nearly 50 per cent of annual energy costs at the Dreisbach facility.
Phase change material for thermal energy storage
Phase Change Material (PCM) is a substance with a high latent heat of fusion which remains near a constant temperature while storing and releasing large amounts of energy. During its transition between solid and liquid states, Viking Cold‘s PCM absorbs up to 85 per cent of heat infiltration and maintains more stable temperatures to better protect food product. This environmentally-friendly, food- safe PCM is engineered by Viking Cold to freeze and thaw at the desired temperature set point of the customer’s freezer.
M&V study design
This M&V study was designed to isolate the temperature and energy benefits of TES in low-temperature cold storage facilities. Three operational variables were measured: Temperature as a function of time, Power Consumption (kWh), and Power Load (kW). Since Viking Cold has implemented TES systems in many other facilities with significant positive results, this study was designed to understand the efficacy of TES under the conditions and challenges of large ammonia refrigerated freezers.
Baseline data capture
To establish the baseline performance of the freezer, all refrigeration equipment ran under normal operating conditions without Viking Cold intervention for three weeks. During this period, the Viking Cold controls equipment measured and captured temperatures, energy consumption, peak demand, and refrigeration equipment status.
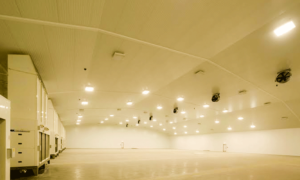
Thermal energy storage installation and configuration
Upon completion of gathering baseline data, the TES modules containing phase change material were installed in the freezer (see Image 1 on page four). The TES modules were installed on top of the highest cross members of the product storage racking in the direct airflow path of the refrigeration evaporator fans.
The integrated Viking Cold control system was con- figured to optimise the operating sequence of refrigeration. Multiple temperature sensors within the freezer provide new inputs to the existing refrigeration control sequence to effectively leverage the thermal energy stored in the TES modules. Viking Cold’s proprietary algorithms calculate how to best manage the refrigeration system to minimise energy consumption while maintaining stable desired temperatures inside the freezer. The key strategy to reducing energy consumption and peak demand is to run the refrigeration equipment fully-loaded during the lower cost off-peak hours when ambient temperatures are lower, which yields maximum mechanical and condensing efficiency as well as lower energy costs.
As ambient temperatures increase during peak hours of the day and the heat rejection of the condenser is less efficient, the control algorithms reduce or stage the run time of the refrigeration system and allow the fully charged TES modules (frozen PCM) to absorb the heat infiltration and maintain temperature stability inside the freezer.
Temperature and energy data are collected at five-minute intervals and securely stored in a cloud-hosted database. Live data is accessible by the operator to monitor conditions inside the freezer with automated notifications and alarms triggered by events set to customer defined parameters. The Viking Cold algorithms are programmed by default to prioritise temperature compliance above energy savings and will automatically restore mechanical refrigeration if necessary to maintain temperatures within acceptable ranges.
One year later, the same data set that was recorded during the baseline was captured again and analysed to conduct the M&V study. In doing so, seasonal weather and business cycle variables were determined not to be a significant factor in the results.
Result: energy consumption reduction
Looking at total energy consumption across the entire facility, post implementation of the TES sys- tem the entire facility experienced a weekday energy consumption reduction of 20 per cent. This was slightly offset by a 5 per cent increase in off-peak week- end consumption by the freezer in order to fully recharge the TES modules in preparation for the following week. The net result was a 13 per cent reduction of energy consumption for the entire facility each week.
Peak Period billing occurs Monday through Friday, 8:30 am through 9:30 pm and accounts for nearly 50 per cent of annual energy costs for the facility. The graph below illustrates the comparison of average weekday energy consumption by hour before and after TES installation.
Result: greater temperature stability
The energy savings and cost reductions detailed above were accomplished while better maintaining operating temperatures within the customer specified range. The data showed that the temperature stability inside the freezer improved with the addition of the TES system. The temperatures measured during the M&V study showed significant improvements in two statistics; hourly standard deviation and rate of rise. Hourly standard deviation is a measure of how much temperature varies from the average temperature during a given hour, quantifying the range of temperatures within the freezer. Rate of rise is a measure of how quickly the temperature rises when the refrigeration equipment is not operating.
Hourly Temperature Standard Deviation
In the graph below on the left, the hourly standard deviation during pre-TES baseline measurement duration is consistently about 4°F throughout the day. The second graph below on the right shows the hourly standard deviation after TES installation, where the system prioritized performance during the peak period. During this period, the TES system reduced the hourly standard deviation to approximately 2°F, a 50 per cent improvement in temperature stability. This demonstrates that even during periods when the refrigeration equipment is not operating the release of stored thermal energy can better control temperatures in the freezer.
Rate of Rise
This M&V study also conducted an experiment to quantify the rate of temperature rise with and without TES inside the freezer. Temperatures were measured in multiple locations within the freezer. For each location, measurements were taken at two vertical elevations. One set of temperature monitors was positioned vertically at the middle pallet position, and the second set was positioned vertically at the top pallet position to identify and quantify temperature stratification. The same experiment was performed during the baseline period before TES was installed and again after the TES system was installed. For each experiment, refrigeration was completely shut off and temperature data was recorded for 15 hours.
Thousands of individual temperature data points are illustrated in the chart above. The shaded bands repre- sent the range of temperatures recorded, and the solid lines represent the average temperature in the room.
During the baseline rate of rise test without TES, the average temperature in the room exceeded the upper customer specified limit after 6 hours. Note that the upper pallet positions recorded temperatures above the limit within minutes after refrigeration was shut off. After TES was installed, the average temperature in the room remained within the limit for the entire 15-hour duration of the test, and the upper pallet positions remained within the upper limit even with refrigeration shut off.
These results illustrate how the TES system is able maintain the temperature integrity of the products despite temperature stratification inside the freezer while reducing energy usage of the facility for over 15 hours in this case.
Rate of Rise Findings:
- Without TES: baseline average temperature exceeded upper limit after only 6 hours
- With TES: temperatures at the top of the room remained below the upper limit
- With TES: average temperature remained below upper limit for 15 hours
- With TES: temperatures can be effectively managed even without refrigeration
M&V Study Conclusions
The objectives of the M&V study were to determine the effectiveness of Thermal Energy Storage on energy efficiency and temperature stability with an ammonia-based refrigeration system. The results demonstrate the ability of TES to reduce energy consumption by 43 per cent and reduce peak demand by 29 per cent while maintaining 50 per cent more stable temperatures in a warehouse. TES technology has significant operational and financial benefits to cold storage operators, to the cold storage industry, and to the utilities which are challenged to manage the peak loads on the electrical grid.
For more details, contact:
Viking Cold Solutions, Inc.
vikingcold.com/resources
Cookie Consent
We use cookies to personalize your experience. By continuing to visit this website you agree to our Terms & Conditions, Privacy Policy and Cookie Policy.